What Is a Horizontal Bar Graph?
Follow Us:
Twitter
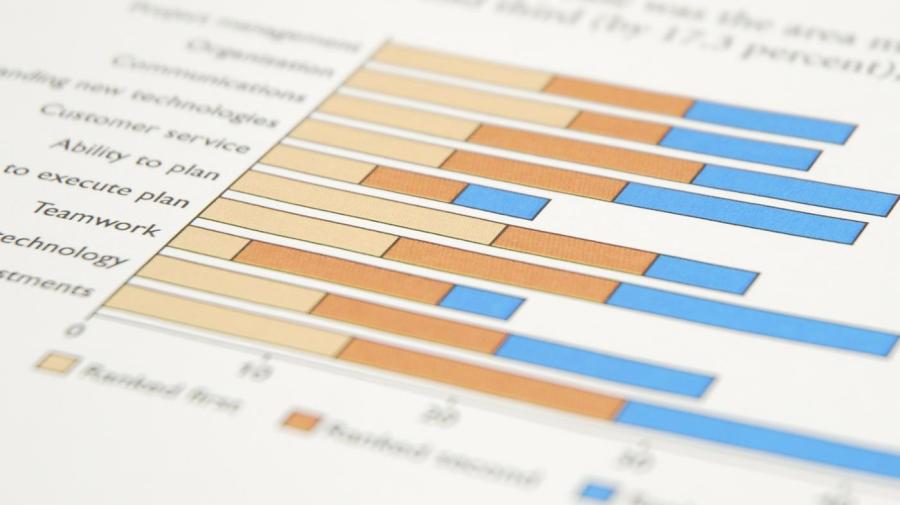
A horizontal bar graph is a visual representation of data that include a series of horizontal bars representing numerical amounts. Variations in the lengths of the bars allows for quick comparisons.
In a horizontal bar graph, the length of the bar from left to right represents the magnitude of each particular value. For example, consider a horizontal bar graph of the average daily high temperature in a particular city for each month of the year. The bars corresponding to the summer months are longer than the bars for the winter months, while the bars for spring and fall months have intermediate lengths.


